


Tables (along with figures) are used to present data in a concise and effective manner. Text can also be used to present results. In fact, simple results that can easily be explained in words are best this way. But tables are best when you have large amounts of data, such as results from many trials.
What you’ll learn in this post
When to use tables
Tables are generally used to present large amounts of exact values of qualitative or quantitative data, rather than quantitative information such as trends or patterns.
Tables can be used to summarize information from the Methods or Results. When preparing tables, keep in mind that they must be able to stand alone. That is, they should be fully comprehensible without the reader having to refer to the main text.
Also make sure that your tables are numbered consecutively.
Table titles
Tables should have concise, descriptive, specific titles. The title is normally a phrase rather than a complete sentence and usually does not contain ending punctuation.
Some journals have specific requirements for word counts, so you should always check your target journal’s author guidelines when considering your title. Many journals require short titles for tables (generally no more than 15 words), but will allow additional explanation in the form of footnotes.
Keep in mind that the title should not interpret the results found in the table. That information should only be presented in the text of the results section.
Table length
Try to avoid extensive tables that span two or more pages. Generally, these should be split into two tables, with the aim of presenting only one table per page. If this is impractical, you should consider whether it would be more appropriate to submit the table as supplemental material (if allowed by your target journal).
Remember that journal editors and reviewers often look at the figures early on, so these should be self-contained or stand alone.
Apart from the main illustrative item and any labeling, each display item needs a number, a title, a description (legend) that explains the labeling, and any footnotes that explain special information, abbreviations, symbols, or statistics.
You can group related display items as one multi-panel figure, but be sure to number or letter the panels and refer to the numbering/lettering in the legend.
Table structure
Tables consist of columns and rows, with corresponding column and row headings. Column headings indicate the items below them. They should be descriptive, concise, and consistent in syntax.
Row headings are in the leftmost column of the table. They describe the condition each row represents. The units of measure for the variables being presented should be included in the headings, rather than in the actual data field (cell).
Table data
Data cells make up the body of the table. Data should be presented consistently, especially when rounding values and reporting p-values. A table footnote can be used to include any explanations of abbreviations used in the table, and any other relevant data.
There should be no empty data cells, and no unnecessary elements should be included. Make sure you explain and use notation such as NA (not available) or ND (not done), rather than -, /, or 0. Discrepancies in data and statistical methods used should also be included in the footnote.
Some journals require the use of specific footnote symbols in a particular order; others prefer the use of lowercase (and sometimes superscript) letters. Asterisks (*) are generally reserved for indicating statistical significance.
Regardless of the notation you use, all symbols and abbreviations should be defined in a footnote.
A table example
This table shown above is a truncated version of a table in a paper published in The Journal of Clinical Investigation (doi:10.1172/JCI37622; reproduced with permission).
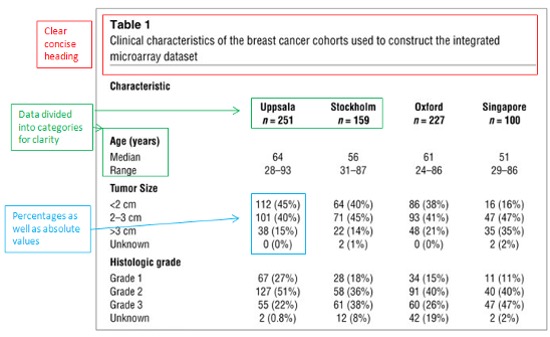
The data presented clearly and economically in this table would’ve required a lot of word space if described in the text.
All that was required to describe this table in the main text was: “Clinical characteristics of all patients and tumor samples are summarized in Table 1.”
Journal-specific issues for tables
Carefully check the author instructions to be sure that your tables meet your target journal’s guidelines.
Some journals may accept tables in spreadsheet format. But if in doubt, tables should be prepared using the table function in your word processing software (typically, that will be Word). Don’t use tabs or the space bar to format text in your tables. Doing so can cause the whole thing to fall apart or show up incorrectly on another screen.
Although the requirements for tables vary from journal to journal, excessive use of grid lines is generally discouraged because it may make the table appear cluttered and difficult to interpret.
Some journals state that tables should not contain vertical lines, whereas some journals require that all grid lines remain visible. Double line spacing is usually required, though some journals are not specific about spacing. Keep your table as simple as possible: color, italics, and highlighting should be avoided. Most journals, both in print and online, will publish tables in black and white only.
Common mistakes with tables
- Use of tables to present simple data that can easily be presented more concisely as text.
- Duplication of data between tables and text. Although some overlap may be unavoidable, you should make an effort to minimize this whenever possible.
- Not citing tables in the text. During manuscript preparation, text is sometimes shifted and relocated, resulting in table citations appearing in the wrong order. As a final check after all editing or revision rounds, you should carefully check that all tables have been cited in the correct order.